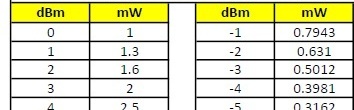
What are we looking at? TL;DR: With Wi-Fi the reference power is 0 dBm which is 1 milliwatt. The scale is logarithmic, so every 3dB is a doubling of transmit power, and every +10dB is 10X the power. Likewise, -3dB is half power and -10dB is 1/10th the power. Here is a handy look-up table from -40 to +40 dBm just for quick reference.
See further below (after the conversion chart image) for a more complete explanation.
Conversion Table

Background
More complete explanation: In Wi-Fi and RF, transmit power is usually expressed in dBm, which means decibels referenced to 1 milliwatt. So this is a logarithmic unit that references power relative to 1 milliwatt (mW). And it all starts with 0 dBm = 1 milliwatt as the starting point.
Since it is logarithmic, instead of increasing linearly, the dBm scale compresses a very wide range of power levels into more manageable numbers (like 0 to 30). This is especially useful in wireless systems, because signal levels can range from tiny fractions of a milliwatt to multiple watts.
Because the scale is logarithmic, equal steps in dB represent multiplicative changes in power, not additive ones. This gives rise to the so-called rule of 3s and 10s of dB math.
The rule of thumb is:
+3 dB = 2x the power
+10 dB = 10x the power
+20 dB = 100x the power
And in the opposite direction (perfectly symmetrical):
-3 dB = ½ the power
-10 dB = 1⁄10 the power
-20 dB = 1⁄100 the power
Using these rules of thumb, we can find some easy ways to calculate certain gains, and move easily between linear ratios and decibels without a calculator.
For example, how about a gain of 4000? We can imagine that as 10 x 10 x 10 x 2 x 2 = 4,000. Which would be 36dB. (10+10+10+3+3) How about a gain of 5000? We can think of that as 10 x 10 x 10 x 10 / 2, so in dB that would be 10+10+10+10-3 = 37 dB.
How about -60 dBm? That would be 1mW / 10 / 10 / 10 / 10 / 10 / 10, which gives 0.000001 mW or 1 nW (1 nanowatt). Here’s another way to think about that: -3 dBm x 20 (divide by 2, 20 times). This helps explain why RSSI values fall so quickly with distance, because every 3 dB halves the power.
And for completeness, how about that common value of -67 dBm? Well, from the -60, we would have to do another -3 (0.5 nW), then another -3 (0.25 nW), and finally a -1 to get us to -67 and we would intuitively realize we’re around 0.2 nW. Now go and look it up in the table above to be sure! 😁
Importance
Why do we care? Because small changes in dBm can represent large real-world power/signal differences.
Suppose for example you increase transmit power from 17 dBm to 20 dBm. Doesn’t sound like much, right? “Only adding 3dB” actually DOUBLED your actual RF output power.
Looking at it another way (at the opposite end of the scale), a client receiving a signal at −30 dBm is receiving just 1 microwatt of power. This helps illustrate how small the actual RF energy is, even when the signal is considered “very strong”.
For comparison, -60 dBm corresponds to 1 nanowatt, which is a much weaker but still “good” Wi-Fi signal. Modern Wi-Fi receivers can successfully demodulate signals even below this level, and usable Wi-Fi links can operate at received powers in fractions of a nanowatt.
Back to the main point, small changes making big differences: This is why wireless engineers tend to think in dB steps rather than raw milliwatts. The math stays intuitive even though the power changes can be dramatic. But it is still helpful to see and understand it in actual milliwatts, so I made the table.
Lower Limits
How low can we go? The “weakest” signals (negative dBm values) will be received signals, not transmitted signals. Received Signal Strength Indicator (RSSI) describes how much RF power is arriving at a client’s antenna, not how much power that device is transmitting. Although the numbers are negative, the less-negative values represent stronger signals. -30 dBm is 1000x stronger than -60 dBm.
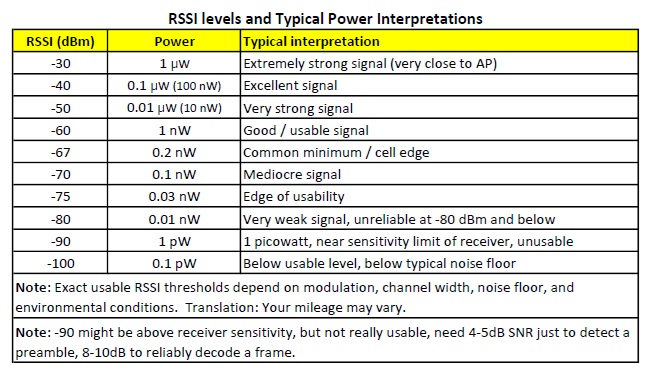
What surprises many people new to Wi-Fi is just how small these power levels are: even a “very strong” Wi-Fi signal at −30 dBm is only one microwatt, while a usable signal at −60 dBm is measured in nanowatts. -65 or -67 dBm are common values for the edges of a coverage cell for example. The “thermal noise” is theoretically around -100 dBm for a 20MHz channel. Receive sensitivities might be in the range of the mid -90s. But you need need 4-5dB signal to noise ratio just to detect a preamble, and at least 8-10dB SNR to reliably decode a frame. So -90 dBm would not really be a usable signal, while perhaps -80 could be, and now we’re talking about picowatts (billionths of a watt).
Let’s take a look at this in another table that makes it clear.
D.I.Y.
Make a table, do it yourself: By the way, if you want to create your own table in a spreadsheet, for the cells in column B, I simply used the formula =ROUND(10^(Axx/10),0) where Column A has the number sequence 1 through 40 and xx represents the row number.
For example, for 15 dBm in column A the cell in column B would be =ROUND(10^(A15/10),0) which calculates to 31.62 but for that column I wanted to round to the nearest milliwatt.
However, for the negative dBm part of the table, I used column D to range from -1 to -41, and for column E (milliwatts) I used =ROUND(10^(Dxx/10),4), and also added column F for microwatts using =ROUND(10^(Dxx/10)*1000,2) and then for the rightmost set of columns, I used ,5 for the rounding factor and multiplier of *100000 for the nanowatt column.
No particular reason why I chose to round where I did, except to make the table easier on the eyes.
Additional reference
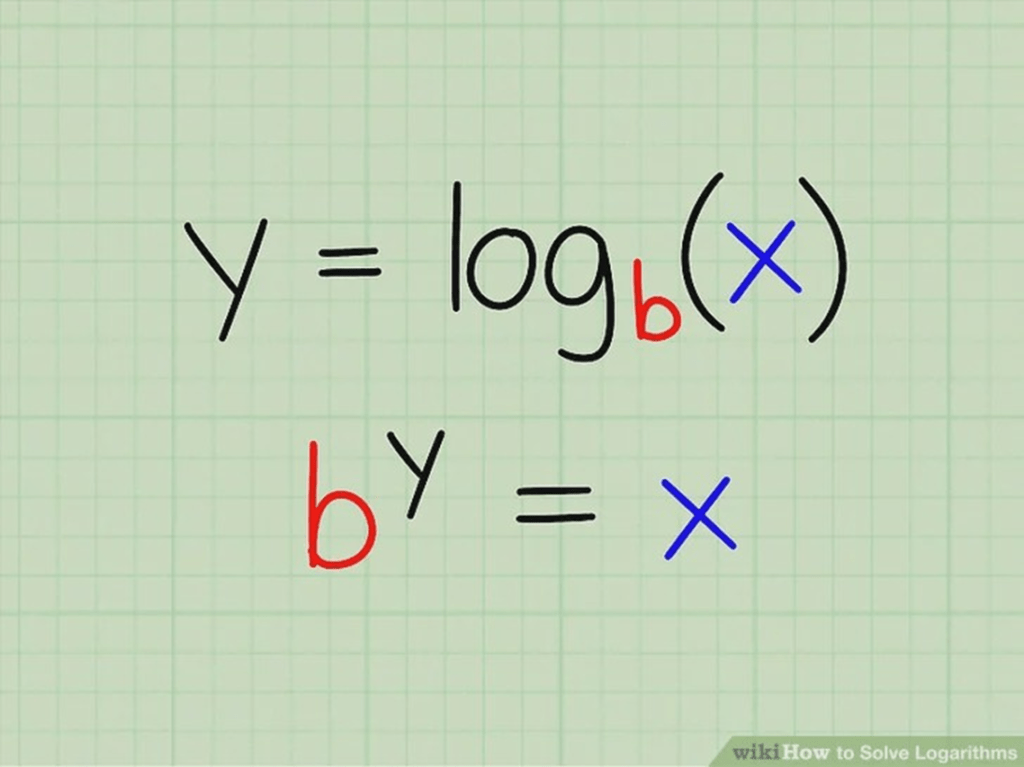
Logarithms: Wait, what? A logarithm is an exponent. The (base 10) log function gives a number that is the power to which you must raise ten to get the original number. Logarithms give us a linear way to represent logarithmic functions, this way gains and losses become additive, just add and subtract dB values.
So if X=10^Y then log(X)=Y.
Example: Log(100)=2 because 10^2=100.
The inverse (antilog) is also true, if Y=log(X) then X=10^Y.
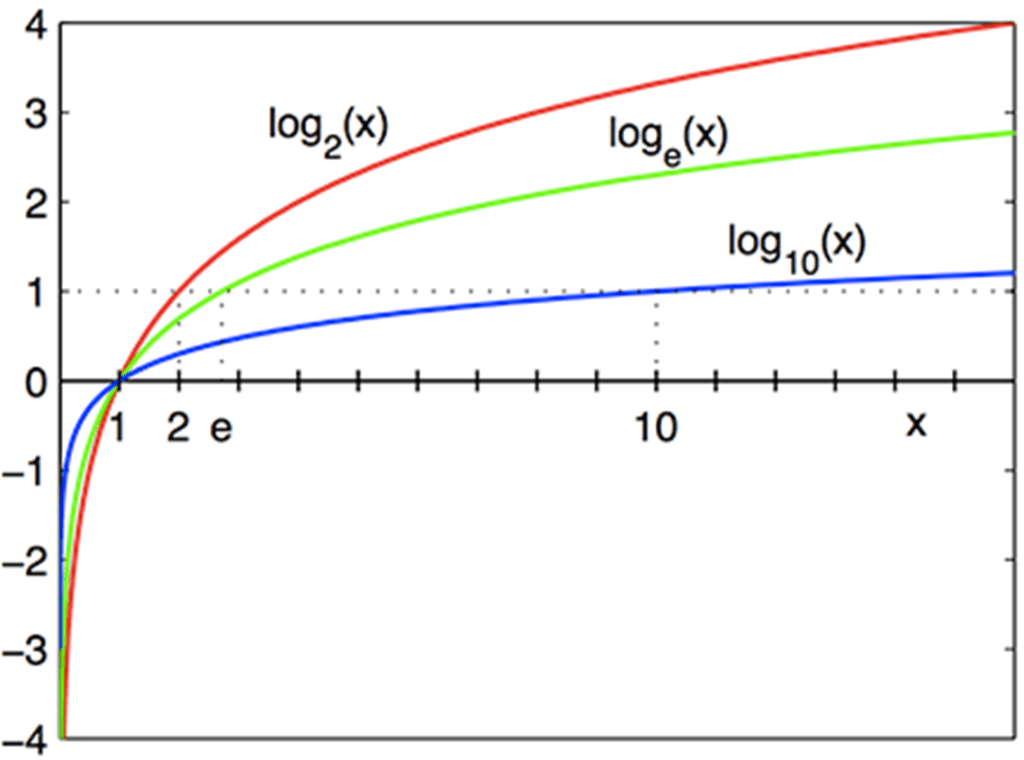
Log functions specify a BASE. The example here is base 10, but you can also have Base 2 and Base e (natural logarithm, shown as “Ln” instead of “log”) for example. Log base 2 of 1024 = 10, 2^10 = 1024. You can see it below on the graph, log base 2 of 16 = 4 where the red line touches the upper right corner, just like log base 10 of 10 = 1 (because 101=10) where the blue line crosses the point (10,1).
Ok, fine. What’s it got to do with RF and Wi-Fi? Radio Frequency signals decay logarithmically as they propagate, this is the inverse of exponential growth. In RF we call it the inverse square law.
RF power measurements are logarithmic and use decibels (dB) to compare received power with transmitted power. Since logarithms give us a linear way to represent logarithmic functions, the gains and losses become additive, so we can just add and subtract dB values.
While the watt is the basic unit of electrical power, in unlicensed RF this is a LOT of power, so we use 1 milliwatt as the reference point. 1mW = 0dBm.
So a dB is a relative expression, a ratio, while dBm is an actual power level.
dB=10 Log10(Pa/Pb) and dBm=10Log10(Power / 1mW) or Pdbm=10 Log(PmW)
The SNR, Signal to Noise Ratio, compares (in dB) the signal strength versus the background noise (the noise floor). Imagine listening to one person’s voice in a noisy dining room. Think of it like the desired signal (the conversation you’re focused on) versus the ambient noise of everything else in the room like other conversations, phones ringing, background music, kitchen noise, etc.
Hope that helps! For some additional references, simply do a web search on “Wi-Fi RF Math”.
